Three Boroughs, Three Directions: What Q3 2026 Home Prices Show Across Manhattan, Brooklyn and Queens

Third-quarter 2026 reports released October 6 put New York City’s three largest sales markets on different paths: a Manhattan median up 10.9%, a Queens median up 14.1%, and a Brooklyn median down 1.0%, each measured against the same quarter of 2025. Read side by side, the figures look like a split. Read more closely, much of the gap comes from what each report counts.
Q3 2026 at a Glance
| Borough | Median sale price | Change vs. Q3 2025 | Median time to sell | What the figure covers |
|---|---|---|---|---|
| Manhattan | $1,275,000 | +10.9% | 91 days on market | All apartments |
| Brooklyn | $1,160,500 | −1.0% | 54 days to contract | Co-ops and condos |
| Queens | $775,000 | +14.1% | 62 days to contract | Co-ops and condos |
Sources: Milton Coste Q3 2026 borough reports, built on REBNY Listing Service data; Manhattan figures compiled by UrbanDigs for Keller Williams NYC. Updated October 6, 2026.
The last column matters. Manhattan’s number spans every apartment type, while the Brooklyn and Queens numbers cover co-ops and condos only, and sales that never appeared on the REBNY Listing Service, including most new-development sponsor sales, are left out. “Days on market” and “days to contract” are also different clocks, so the time-to-sell column should not be compared line for line.
Reading the Medians by Property Type
Splitting the headline into resale condos and resale co-ops changes the picture.
| Borough | Resale condo median | Change | Resale co-op median | Change |
|---|---|---|---|---|
| Manhattan | $1,635,000 | +12.0% | $860,540 | +1.2% |
| Brooklyn | $1,389,000 | +7.7% | $720,000 | −4.0% |
| Queens | $860,000 | +1.2% | $375,000 | 0.0% |
Condos rose in all three boroughs. Co-ops were flat to slightly lower outside Manhattan. Brooklyn’s overall median fell 1.0% even though its condo median rose 7.7%, which points to a mix effect: when co-ops make up a larger share of closings, the blended median can drift down while a segment inside it climbs.
Queens runs the other way. A 14.1% jump in the overall median sits next to a flat co-op median and a 1.2% condo gain, and the report also shows median price per square foot up 30.8%. Neither segment shown accounts for a rise that size, so the likeliest explanation is a change in which homes closed during the quarter, though the report itself offers no cause and this reading is an inference rather than a finding. Queens house prices, which fall outside the co-op and condo median, were down 6.7% to $1,150,000.
Two Manhattan Medians for One Quarter
Manhattan produced two different headline numbers. The UrbanDigs report for Keller Williams NYC puts the median at $1,275,000, up 10.9%. Corcoran’s report puts it at $1.25 million, up 4%, a third-quarter record and the seventh straight quarter of year-over-year gains. Different data pools, different treatment of new development and different rules for what counts as a sale can produce gaps of this size without either report being wrong.
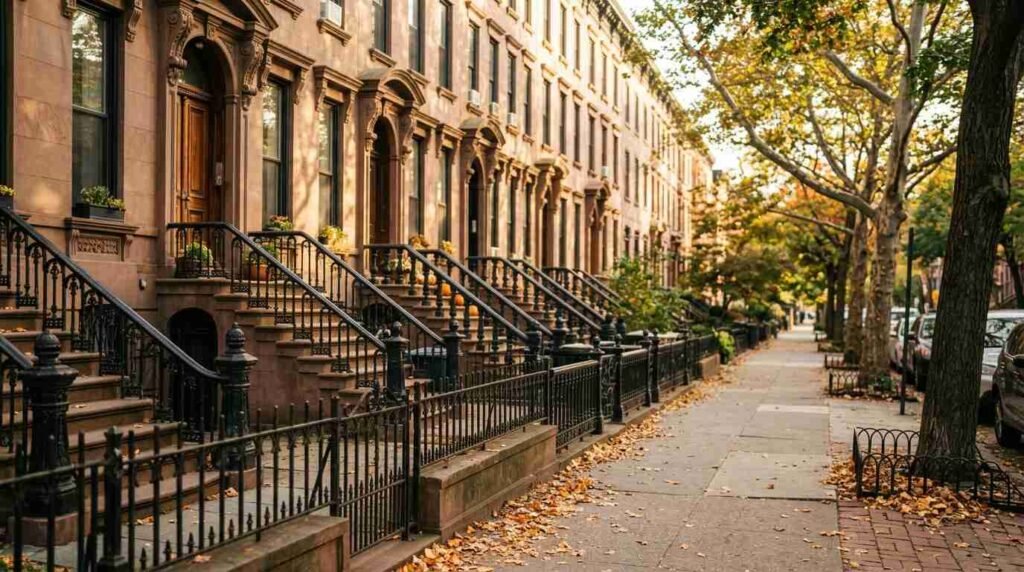
Beyond price, Corcoran’s report shows supply tightening. Active listings stood at 6,354, down 3% and the lowest third-quarter level since 2017, while closed sales rose 9% to 3,625. Signed contracts, a forward-looking measure, fell 6% to 2,532. Corcoran President and CEO Pamela Liebman summarized the setting this way: “buyers are competing for a shrinking pool of homes.”
Inside Manhattan, the UrbanDigs figures show wide swings by area, from Downtown at $1,790,760 (+23.5%) and Midtown at $1,195,000 (+20.1%) to Upper Manhattan at $640,000 (−5.5%). The luxury tier moved against the overall trend, with the top-10% median at $6,337,500, down 7.0%.
Brooklyn: Longer Waits, Steady Bidding
Brooklyn recorded 776 co-op and condo sales, down 14.7%, and a median of 54 days to contract, up 26.7%. The median sale price landed at 100.0% of list, unchanged from a year earlier. Fewer deals and slower contracts alongside flat pricing describe a market where sellers held their asking prices while buyers took longer to commit.
Competition at the individual-listing level stayed intense, however. StreetEasy’s August report found 31.9% of Brooklyn homes sold above their latest asking price, against 24.2% in Queens and 16.0% in Manhattan. “Competition was strongest in Brooklyn,” StreetEasy’s Kenny Lee said in the report. Those figures cover a different month and a different measure than the quarterly medians, which is how a borough can show falling volume and frequent above-asking sales at once.
More listings did not translate into more signed deals in the neighborhoods tracked by the Riolo Properties Team at Compass. In its September roundup for school districts 13 and 15, republished by the Brooklyn Bridge Parents blog, combined active listings reached 269 against 274 a year earlier, and the blog’s summary put the pattern plainly: “contracts did not rise with inventory.” The same post lists 49 contracts in District 13 and 46 in District 15 for September.
Queens: Faster Sales, Higher Price Per Square Foot
Queens posted 210 co-op and condo sales, up 10.5%, with a median 62 days to contract, down 18.8%. Sale price as a share of original asking rose 2.8 points to 100.0%. Speed, volume and pricing all moved in the same direction, which is the clearest case of strengthening conditions among the three boroughs, even if the size of the median increase partly reflects which homes happened to close.

Using the Numbers
Buyers and sellers comparing boroughs gain more from the segment tables than from the headline percentages: the property type, the price tier and the neighborhood tend to matter more than the borough average. Households weighing the city against the suburbs often add Long Island to the comparison, and the posts on Nassau County versus Suffolk County for NYC transplants, the complete guide to relocating to Long Island from NYC and the LIRR commute cover that side of the decision.

This is for informational purposes only — consult a licensed attorney or financial advisor for your specific situation.
Frequently Asked Questions
Why do two reports show different Manhattan median prices for the same quarter?
Each report draws on its own data pool and its own rules for new development and closed-sale reporting. For Q3 2026, UrbanDigs reported $1,275,000 (+10.9%) and Corcoran reported $1.25 million (+4%).
Did Brooklyn prices fall in the third quarter of 2026?
The median for co-ops and condos was $1,160,500, down 1.0% year over year. Brooklyn’s resale condo median rose 7.7% while its resale co-op median fell 4.0%, so the overall dip reflects the blend of property types.
Are Brooklyn and Queens figures comparable to Manhattan’s?
Only loosely. The Brooklyn and Queens medians cover co-ops and condos recorded on the REBNY Listing Service, while the Manhattan median covers all apartments.
Do these reports predict where prices will go next?
No. They describe closed sales and market conditions from July 1 to September 30, 2026, and conditions can change quickly.
You Might Also Like
- The Great Neck vs. Manhasset Decision: How Two Gold Coast Zip Codes Serve Completely Different Buyers
- What Closing Costs Actually Look Like on Long Island
- Mortgage Rates Moved Three Times in One Week — What That Volatility Signals for June
Real estate markets change. For current listings and market data, contact Maison Pawli at maisonpawli.com/about/.
Sources
- Milton Coste, Manhattan Market Report, 3Q 2026 (UrbanDigs for Keller Williams NYC; updated Oct. 6, 2026)
- Milton Coste, Brooklyn Market Report, 3Q 2026 (REBNY Listing Service via Trestle/Cotality; updated Oct. 6, 2026)
- Milton Coste, Queens Market Report, 3Q 2026 (REBNY Listing Service via Trestle/Cotality; updated Oct. 6, 2026)
- Corcoran, Manhattan Real Estate Market Report, 3Q 2026
- StreetEasy, NYC homes sell above asking at highest rate in four years (Sept. 15, 2026)
- Brooklyn Bridge Parents, Property Sales in Our Brooklyn Neighborhoods: September 2026 (Oct. 6, 2026; data from the Riolo Properties Team at Compass)