Counting the Buildings on the 1873 Beers Map of Setauket and East Setauket

Page 162 of the 1873 Atlas of Long Island, New York, published in New York by Beers, Comstock & Cline, carries a single plate headed Setauket and East Setauket, with an inset map of Mount Sinai beneath it and a small map of Lakeland, in the Town of Islip, beside that, and the main map marks each house, store and mill that the surveyors recorded as a black symbol set next to a landowner’s name. A first systematic count of those symbols, made with a repeatable image method and checked by hand on sample patches, puts the number drawn inside the Setauket and East Setauket map at roughly 200, within an informal range of about 170 to 230.
The figure measures a drawing, not a population of households, and the sections below set out how it was produced, how far it can be trusted, and what the arrangement of the symbols shows about where building had gathered by 1873.
The plate and what it draws
The New York Public Library holds the atlas in its digital collections, offers each plate as a full-size image, and states that it believes the Setauket plate is in the public domain under United States law, with a request, not a requirement, that reuse carry the credit line “From The New York Public Library.” At full size the plate measures 4,696 by 6,126 pixels. The main map prints a scale of 60 rods to the inch, which at 16.5 feet to the rod equals 990 feet to the inch, or 1:11,880, and the Mount Sinai inset repeats the same scale.
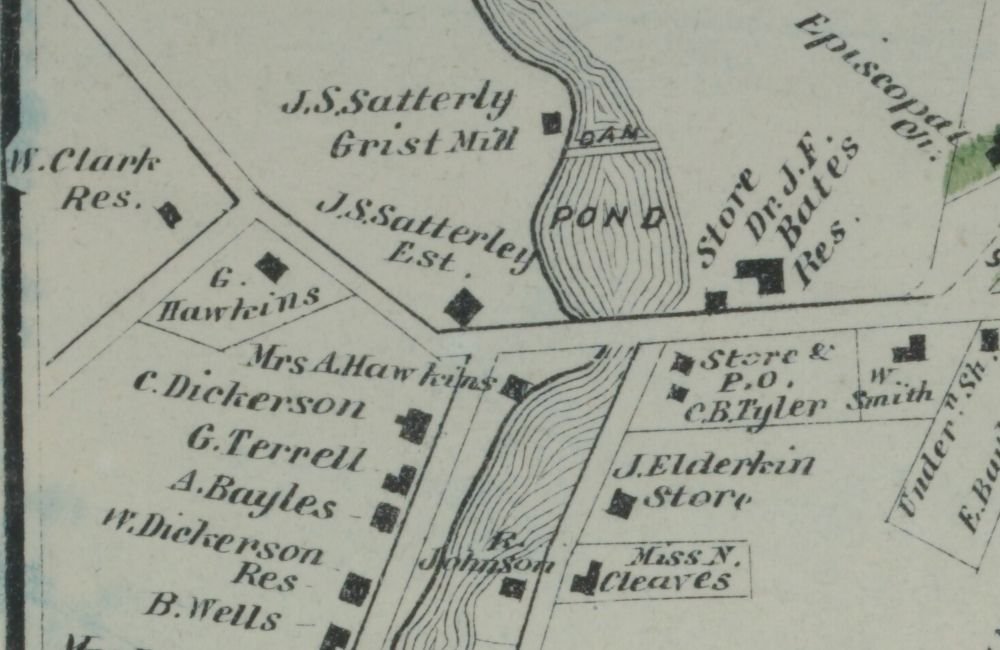
Buildings appear as solid black shapes, many of them L-shaped or irregular, placed beside a surname and a lot outline; roads are drawn as double lines, sloping ground as contour hatching, and water as a tinted area, so that the sheet reads as a property map in which each owner’s holding and each structure on it are shown together. A symbol records that something stood at about that place in 1873, and the mark is a convention of the mapmaker, not a surveyed footprint, which is why everything counted here is a count of symbols.

How the symbols were counted
The plate was converted to brightness values, every pixel darker than about half of the brightness scale was marked, and a two-pixel erosion then stripped away the thin strokes of lettering and lot lines while leaving the thicker solid symbols standing. Connected groups of marked pixels were kept as candidate buildings when they were compact (between 4 and 34 pixels on a side), reasonably full (at least 45 percent of their bounding box) and large enough to survive the erosion. Each kept shape is recorded as a position and a size in plate pixels.
The count was confined to the interior of the main map frame, which leaves out the heading banner and the border rules that otherwise produce a row of false hits along the top edge. Across the whole plate the method flagged 349 shapes, of which 202 fall inside the main map, and the other 147 sit in Lakeland, in the Mount Sinai inset, in the heading banner or on the border rules.
What the hand checks showed
Three patches of the main map, each 1,000 by 650 pixels, were checked by eye with the detections drawn as boxes: the area around Carleton Avenue and Baptist Street, a stretch along a mill pond and the road beside it, and a block of small lots in the lower middle of the map. In those patches the method drew 70 boxes, of which 57 sat on real building symbols and 13 on lettering, lot numbers or small marks, while the reader found 11 further symbols that no box had caught, most of them touching a word or a line.
That works out to a precision of about 81 percent and a recall of about 84 percent, and the 70 detections stood against 68 symbols in the hand count, a near match overall because the two kinds of error roughly offset one another. Applying the same ratio to the 202 shapes inside the main map gives about 195 buildings.
A single reader checking three patches cannot support a tight interval, which is the reason the result is stated as roughly 200 within an informal range of 170 to 230 and not as an exact total. An independent second reader working on randomly chosen patches, with the agreement between the two reported, would be the natural next test.
Where the buildings gather
To describe the arrangement without relying on ground distances, which would need the plate’s exact printed dimensions, the interior of the main map was divided into a grid of eight columns and six rows, each cell 475 pixels wide and 518 pixels tall, and the detections were tallied by cell. The table gives the counts, with rows running from the top of the sheet to the bottom and columns from left to right.
| Row | Col. 1 | Col. 2 | Col. 3 | Col. 4 | Col. 5 | Col. 6 | Col. 7 | Col. 8 | Row total |
|---|---|---|---|---|---|---|---|---|---|
| 1 | 5 | 0 | 1 | 4 | 11 | 7 | 2 | 0 | 30 |
| 2 | 7 | 15 | 6 | 1 | 15 | 8 | 2 | 4 | 58 |
| 3 | 15 | 0 | 1 | 4 | 21 | 11 | 5 | 0 | 57 |
| 4 | 12 | 0 | 0 | 3 | 10 | 1 | 4 | 1 | 31 |
| 5 | 5 | 0 | 0 | 1 | 3 | 1 | 1 | 0 | 11 |
| 6 | 5 | 1 | 0 | 0 | 5 | 3 | 1 | 0 | 15 |
| Total | 49 | 16 | 8 | 13 | 65 | 31 | 15 | 5 | 202 |
Two bands carry most of the weight. The two leftmost columns hold 65 of the 202 detections (32 percent) and columns 5 and 6 hold 96 (48 percent), against 21 in the columns between them and 20 in the two at the right edge, so that about four in five detected buildings fall in the left strip and the central band. The plate’s heading names Setauket on the left and East Setauket on the right, and the two bands sit under those names, which fits a reading of them as the two village centers, although the grid itself identifies no place.
Concentration is sharper at the level of single cells. The three fullest cells contain 51 buildings (25 percent) and the six fullest contain 89 (44 percent), while 12 of the 48 cells, a quarter of the grid, contain none. Rows 1 to 4 hold 176 detections (87 percent) and the two lowest rows hold 26 (13 percent), which matches what the sheet shows to the eye: the lower part is largely open ground crossed by a few roads and the railroad line labeled on the plate.
Lots laid out ahead of building
Not every lot drawn on the sheet carries a building. In the Carleton Avenue and Baptist Street patch, ten numbered lots laid out along the street appear without a building symbol on any of them, a sign that the land had been divided on paper before anyone had built on it when the surveyors drew the sheet. A tally of such empty numbered lots across the whole plate is another measurement the map alone can supply, and it bears directly on the question of how parcels were later divided, joined or left whole.
The Mount Sinai inset and Lakeland
Lakeland lies in the Town of Islip, as the plate’s own heading states, and falls outside the area studied. The Mount Sinai inset belongs to the Town of Brookhaven, but its buildings are drawn as hatched gray symbols in place of solid black ones, and when the same method was tried on a sample patch it caught only a small fraction of the roughly twenty symbols in view while flagging several letters, so no count is reported for it. A different detection method, or a careful manual count, would be needed for that inset.

What the map cannot say
A count of symbols says nothing about which buildings still stand. Comparing 1873 positions with present-day records needs a modern source that records a year built or a footprint, and the state’s public tax-parcel layer, queried on October 27, 2026, carried a year built for 80,496 of Suffolk County’s 586,600 parcels and for none of the 171,856 parcels in the Town of Brookhaven, so a study of survival would need that information from the town assessor or another source.
Two Coast Survey sources could serve as independent checks on the atlas. Stony Brook University Libraries describe the Coast Survey maps of Long Island made between 1834 and 1845 as including individual houses and fields, and its repository holds an 1874 Coast Survey sheet of Port Jefferson, Setauket and Conscience Bay, dated a year after the atlas appeared.
Position is the remaining limit. Because the symbols are drawn by convention, a detected position is good only to about the width of a symbol, and this article reports no ground distances for that reason.
Sources
- Beers, Comstock & Cline, Atlas of Long Island, New York (1873), plate for Setauket, East Setauket, Mount Sinai and Lakeland, New York Public Library Digital Collections: https://digitalcollections.nypl.org/items/6b69f8e0-c5f7-012f-c003-58d385a7bc34
- Beers, Comstock & Cline, Atlas of Long Island, New York (1873), title page, New York Public Library Digital Collections: https://digitalcollections.nypl.org/items/4d1d4f80-c5f7-012f-8a6e-58d385a7bc34
- New York State, NYS Tax Parcels Public feature service, 2024-2025 parcel data: https://gisservices.its.ny.gov/arcgis/rest/services/NYS_Tax_Parcels_Public/FeatureServer/1
- Stony Brook University Libraries, Popular Maps for LI Research: https://guides.library.stonybrook.edu/c.php?g=35399&p=224910
- Stony Brook University Libraries, Long Island Coastal Maps Collection, Port Jefferson, Setauket and Conscience Bay [Reg. No. 1399]: https://repo.library.stonybrook.edu/xmlui/handle/11401/122021
Related reading
- Setauket Village Green: Churches, Rock and Layout
- Three Village Historical Society: Setauket Walking Guide
- Setauket, East Setauket, and South Setauket: What’s Actually Different Between Them
This article is general information about a historical map. It is not legal, financial or real estate advice, it makes no statement about any present-day property, owner or neighborhood, and nothing in it is a valuation; questions about a specific property belong with a licensed professional.