
Thirty Days on Market Means One Thing in March and Another in July

An agent reports that a house has been listed for thirty days. The seller hears a verdict. A buyer circling the same property hears an opening. Neither reading survives the follow-up question, which is: thirty days starting when?
Days on market is one of the few real estate figures that people treat as absolute while it behaves seasonally. The number moves on a predictable annual curve, the curve is published monthly, and almost nobody prices against it.
The Curve
OneKey MLS publishes days on market until sale every month across its eleven-county service area. Here is the single-family figure across one full year, as reported in the June 2026 Monthly Market Insights, data current as of July 8, 2026:
| Month | Days on Market |
|---|---|
| July 2025 | 37 |
| August 2025 | 40 |
| September 2025 | 46 |
| October 2025 | 48 |
| November 2025 | 52 |
| December 2025 | 52 |
| January 2026 | 57 |
| February 2026 | 59 |
| March 2026 | 64 |
| April 2026 | 59 |
| May 2026 | 53 |
| June 2026 | 44 |
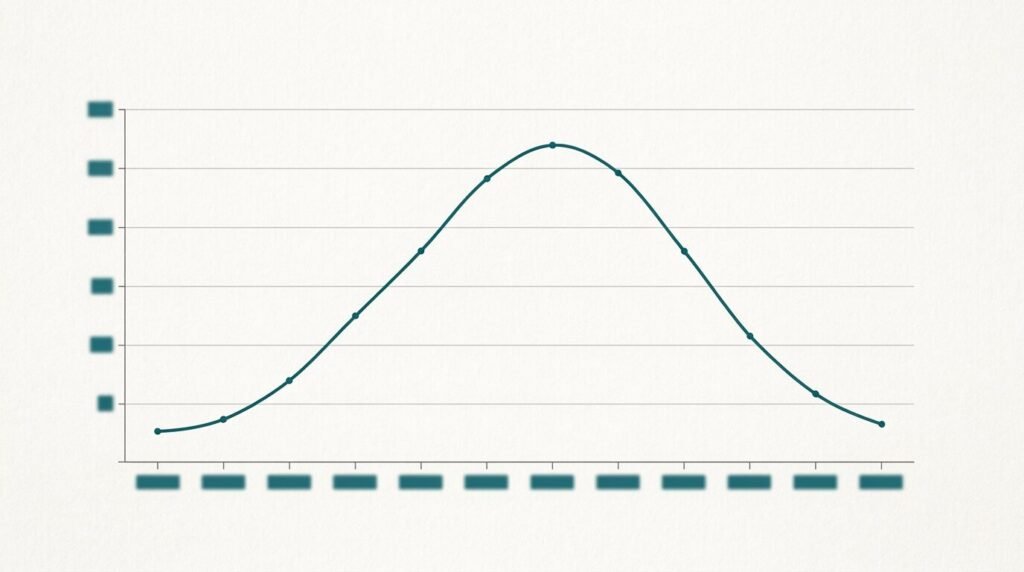
Twenty-seven days separate the fastest month from the slowest, inside a single twelve-month window, in a market whose fundamentals barely shifted across that span. The twelve-month average for single-family properties came in at 50 days.
A seller watching the clock has no idea whether their number is good or bad unless they know which row of that table applies to them.
What the Metric Is Actually Counting
Per the report’s own definition, days on market until sale measures the average number of days between a property being listed and an offer being accepted. Not the closing date. Not the contract-to-close period, which adds its own weeks and varies with financing.
There’s a second wrinkle: the clock is a construct, and it can be reset. A withdrawn and relisted property re-enters at zero. We covered how that works and why sellers should understand it before relisting in Days on Market Is a Calculated Figure, Not a Raw Fact.
Why the Swing Happens
Part of it is behavioral, and part of it is a reporting artifact that trips up even experienced sellers.
The artifact first. A days-on-market figure reported for March describes properties that went to contract in March — which means it is measuring listings that came to market in January and February, in the coldest and thinnest stretch of the year. The metric always lags the season it is labeled with. June’s 44 days is a report card on April and May listings.
Then the behavior. Families with school-age children time moves around the academic calendar, which compresses contract activity toward late spring and early summer so a closing lands before September. Inventory follows the same instinct, which is why new listings peaked at 5,999 in April 2026 and bottomed at 1,988 in December 2025. Buyers who start looking in January are working from a picked-over inventory that has been sitting since fall, and the properties that finally clear in February and March are disproportionately the ones that took longest.
None of that reflects the quality of any individual house.

Two Misreads, Running in Opposite Directions
Spring panic. A house lists in late January and hits day 45 in mid-March. Against a March benchmark of 64 days, that listing is meaningfully ahead of pace. A seller who reduces price at that point is cutting into a market that had not yet finished evaluating the property — and the reduction becomes part of the permanent record for every buyer who looks afterward. The distinction between a strategic correction and a reflexive one is the difference between the two outcomes.
Summer complacency. The same 45 days in mid-July, against a 37-day benchmark, is a listing running behind. Worse, August has historically not been the month that rescues a slow summer listing — the 2025 figures show the calendar turning against sellers from August onward, month over month, straight through the winter. Waiting is the expensive choice in July in a way it simply is not in March.
Buyers make the mirror-image error. Thirty days in July can genuinely signal an opening. Thirty days in March signals nothing worth building a lowball around.
The Number Was Probably Set Wrong Before Day One
Time on market gets scrutinized because the price rarely does — at least not after the listing goes live, when scrutiny is expensive.
Sellers arrive at a list price through a small set of recurring mental routes, and only one of them involves the market. There’s the mortgage payoff figure, working backward from what has to clear at closing. There’s the move-up purchase, where the next house’s price sets a floor under this one’s. And there’s the neighbor’s sign — specifically the neighbor’s list price, which is a number somebody hoped for, not a number anybody paid.
All three produce a figure the market was never consulted about. The market then declines to ratify it, and the seller reads the resulting silence as a marketing problem, a photography problem, or a timing problem, in roughly that order, before considering price.
Seasonal blindness compounds this. A seller who anchored high in February and is measuring the clock against a vague summer-market intuition will wait past the point where a correction still reads as a correction rather than a retreat. By the time they act, the listing is carrying both an inflated original price and an accumulated history.
The related failure modes are worth reading separately: Pricing to the Penny on why cosmetic price psychology doesn’t rescue a bad anchor, and The Art of the Emotional Ask on where emotional pricing is defensible and where it isn’t.

Where the Market Actually Sits Right Now
Some context on what thirty days currently means in practice.
For June 2026, single-family days on market across the OneKey service area was 44, up 4.8 percent from 42 a year earlier. Properties received 101.9 percent of original list price that month. Months supply of single-family inventory stood at 3.6.
At the county level, Nassau’s median single-family sale price reached $875,000 in June, up 2.9 percent year over year; Suffolk’s reached $750,000, up 7.1 percent. Regionally, OneKey put months supply at about 4.1 across all property types, with demand continuing to outrun available inventory.
Writing for The Haydon Team in July, Jim Haydon read the county data the same way, noting that in May, Suffolk homes “sold in an average of 28 days” at a sold-to-list ratio above 102 percent.
Which settles the practical question. On Long Island as of this writing, thirty days is not a distress signal. It is roughly on pace, in a market where the average property is still clearing above its original asking price.
What the Data Can’t Tell You
Two honest limits, because they matter for anyone trying to apply this.
The published monthly report covers OneKey’s full eleven-county footprint — Nassau and Suffolk alongside Manhattan, Queens, the Bronx, and the Hudson Valley. It is not a Long Island-only figure. County-level days-on-market numbers circulating in broker newsletters are secondary readings of underlying data, and they should be treated as such.
There is also no free, published breakdown of days on market by price band. A $600,000 listing and a $1.2 million North Shore waterfront property do not share a curve, and anyone quoting a precise band-level benchmark is either working from a paid data license or estimating. Ask which.
What to Compare Instead
Stop counting days in isolation and start comparing them against something. The full sequence — pricing, preparation, and closing — is laid out in our North Shore Seller’s Guide.
Same month, prior year, same submarket. That is the only comparison that strips out both the seasonal swing and the reporting lag.
Showing cadence rather than elapsed time. Eight showings and no offer is a price problem. Two showings in three weeks is an exposure or condition problem, and the fix is different.
Original list price against current, and whether the listing has been withdrawn and relisted. Buyers and their agents can see that history. Sellers frequently forget that it is visible at all — see Contingent, Pending, or Active for what listing status communicates and to whom.
Thirty days is not a verdict. It is a measurement that requires a denominator, and the denominator changes twelve times a year.
You Might Also Like
- The House That Sits 90 Days Has Already Told the Market Something
- Selling in Spring vs. Selling in October: The Long Island Timing Truth
- Seller’s Market, Buyer’s Market, and the Third Thing Nobody Names
This is for informational purposes only — consult a licensed attorney or financial advisor for your specific situation.
Real estate markets change. For current listings and market data, contact Maison Pawli at maisonpawli.com/about/.
Sources
- OneKey MLS — Monthly Market Insights, Regional Report — days on market by month, new listings, months supply, percent of original list price received. Data as of July 8, 2026.
- OneKey MLS — Footprint Round-Up: NY Metro Home Prices Rise as Buyer Activity Surges — Nassau and Suffolk June 2026 median single-family prices, regional months supply
- OneKey MLS — Market Statistics Center — current and historical reports
- The Haydon Team — Long Island Real Estate: Q2 Records, Fast Sales — county-level May 2026 readings of OneKey data
Data note: All figures reflect the OneKey MLS eleven-county service area unless a county is named. Monthly statistics are revised as late reporting comes in. Verify current figures before quoting to a client.