Three in Ten Suffolk Households Keep Three or More Vehicles
In 2025, 151,441 Suffolk households had three or more vehicles available to them, according to the Census Bureau’s American Community Survey. That is 29.6 percent of the county’s occupied homes, well above the 22.1 percent recorded across the United States. In Suffolk, 60,637 households reported four or more.
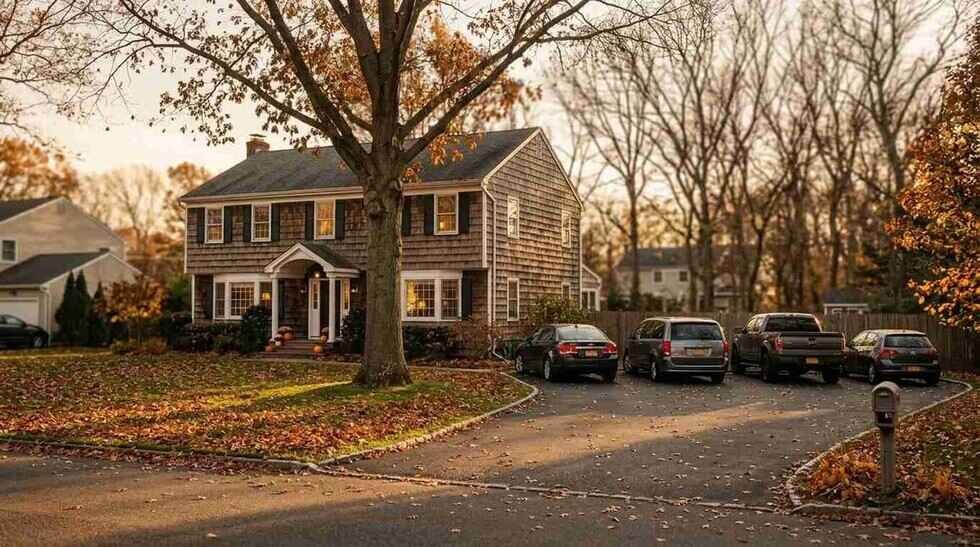
Those vehicles have to sit somewhere every night. On a suburban lot, that means a driveway, a garage or the curb.
What the survey counts
One answer per occupied home
Table B25044 sorts every occupied housing unit by the number of vehicles available to the household, from none to “5 or more.” Because that top category is open-ended, any total built from the table is a minimum. Vacant homes are not in it.
The table also splits every answer by tenure, owner-occupied or renter-occupied.
Two counties, two driveways
Suffolk runs heavier at the top; Nassau has more homes without a car
| Vehicles available, 2025 | Nassau | Suffolk | United States |
|---|---|---|---|
| None | 7.0% | 4.6% | 8.8% |
| One | 28.3% | 27.2% | 33.1% |
| Two | 41.5% | 38.7% | 36.0% |
| Three or more | 23.2% | 29.6% | 22.1% |
| Four or more | 7.5% | 11.8% | 7.7% |
Two vehicles is the most common answer in both counties, as it is nationally. The difference sits at the edges.
Suffolk’s three-plus share runs more than seven points above the national figure, and its four-plus share is about one and a half times the national rate. Nassau looks much closer to the country as a whole at the top of the table, at 23.2 percent with three or more. At the bottom, 32,408 Nassau households have no vehicle at all, 7.0 percent of its homes, compared with 23,418, or 4.6 percent, in Suffolk.

Owners and renters
The car-free households are mostly renters
Among Nassau’s homeowners, 3.7 percent have no vehicle. Among its renters, 21.7 percent do not. In Suffolk the figures are 2.7 percent of owners and 12.9 percent of renters. Nationally they are 3.5 and 18.6 percent.
At the other end, 33.1 percent of Suffolk’s owner households keep three or more vehicles, against 29.1 percent of owner households nationwide. In Nassau the figure is 26.2 percent, below the national rate for owners.
That is as far as the table goes. It does not record who drives the vehicles, how many working adults live in the house, or how far anyone travels.
Ten years of fuller driveways
The three-car household grew faster than households did
The same table from 2015 shows the top of the scale filling in. Suffolk had 133,282 households with three or more vehicles that year, 27.7 percent of its homes. By 2025 the count was 151,441 and the share 29.6 percent, an increase of 18,159 households, larger than the survey’s combined margin of error. Nassau’s three-plus count rose by 9,502, just past the combined margin of error, while its share moved from 22.4 to 23.2 percent.
The national share moved the same way, from 20.3 percent in 2015 to 22.1 percent in 2025. The floor on vehicles per household rose from 2.01 to 2.09 in Suffolk and from 1.77 to 1.82 nationally; Nassau’s edged from 1.88 to 1.90.
Car-free households show no clear change. Nassau had 31,659 in 2015 and 32,408 in 2025; Suffolk’s count went from 26,314 to 23,418. Both differences fall within the survey’s margins of error.
A floor of nearly two million
Counting the vehicles behind the households
Treat every “5 or more” answer as exactly five and the table supports a minimum count. Nassau households keep at least 879,072 vehicles, an average of at least 1.90 per household. Suffolk households keep at least 1,070,800, or 2.09 per household. The national floor works out to 1.82.
Together the two counties’ households keep at least 1,949,872 vehicles for 975,113 occupied homes. The real number is higher, by however many households own six, seven or more.
What a listing has to accommodate
Driveway length, garage use and the curb
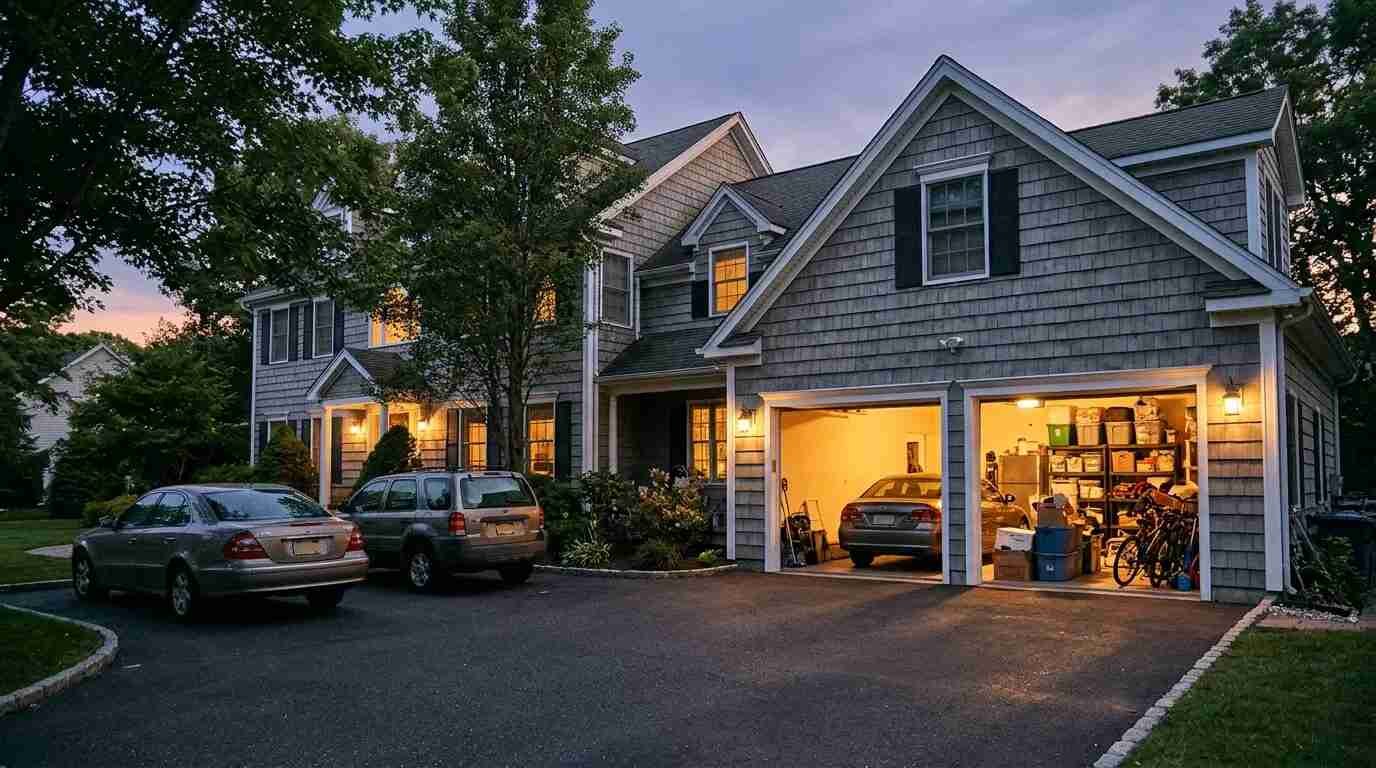
For buyers, the household numbers turn into practical questions about a property. For a household with three or four vehicles, the questions are how long the driveway is, whether the garage is actually used for cars, whether it can be widened under local rules, and whether the street allows overnight parking. Those answers vary by town, by block and by lot, and the municipality is the place to confirm them.
For sellers, a listing can state parking precisely: how many vehicles the driveway holds end to end or side by side, whether the garage is usable for cars, and whether there is a curb cut or a second driveway.
The shape of the household
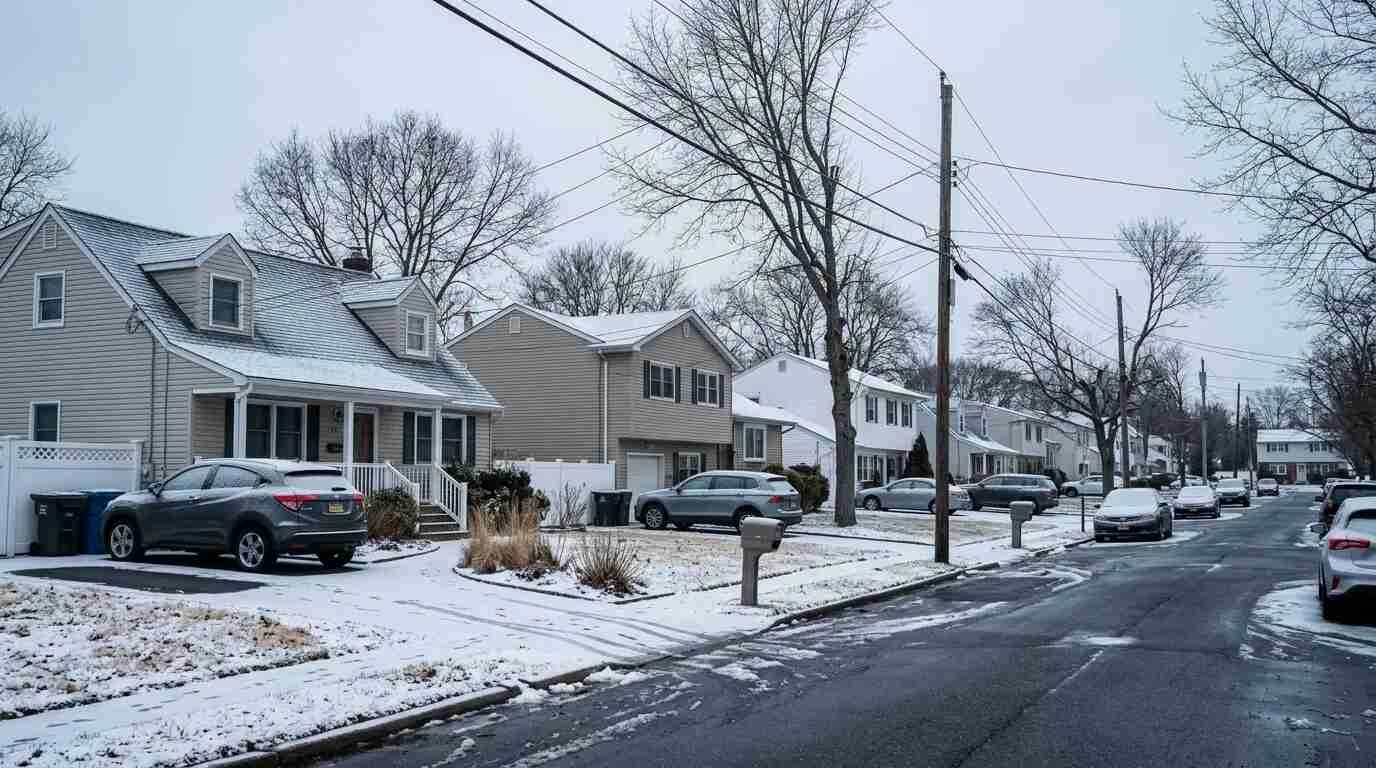
More than a quarter of a million households with three or more
Across both counties, 258,679 households reported three or more vehicles in 2025. In Suffolk, 151,441 households answered three or more. In Nassau, 107,238 did.
The 2025 survey also puts the gap between the counties in one line: car-free homes make up 7.0 percent of Nassau’s households and 4.6 percent of Suffolk’s, a difference of about 9,000 households that clears the survey’s margin of error. How many cars per household Long Island keeps depends a great deal on which side of the county line the household sits.
You Might Also Like
- Huntington vs. Smithtown: Two North Shore Towns, One Rail Line
- Winterizing a Long Island Home Before the First Hard Freeze
- Mount Sinai vs. Miller Place vs. Rocky Point: Three Brookhaven Shoreline Hamlets Compared
Sources
- U.S. Census Bureau, American Community Survey 2025 1-Year Estimates, Table B25044: Tenure by Vehicles Available (Nassau and Suffolk)
- U.S. Census Bureau, ACS 2025 1-Year, Table B25044 (United States)
- U.S. Census Bureau, ACS 2015 1-Year, Table B25044 (Nassau and Suffolk)
- U.S. Census Bureau, ACS 2015 1-Year, Table B25044 (United States)
Shares, totals and minimum vehicle counts in this article were calculated from the Census tables listed above, treating “5 or more” as five.
This article is general information only and does not describe any individual property, buyer or seller. Parking, driveway and curb-cut rules vary by municipality; confirm them with the town or village before relying on them.