Why Sag Harbor’s Whaling Decline Created the Exact Lot Sizes That Make It the Most Walkable Village on the East End Today
The same economic collapse that ended Sag Harbor’s whaling empire accidentally engineered the pedestrian-scale streetscape that drives its real estate premium today.
That sentence sounds like a paradox until you look at a plat map. Then it’s just geography — and geography, on Long Island, is almost always history you can measure in dollars per square foot.
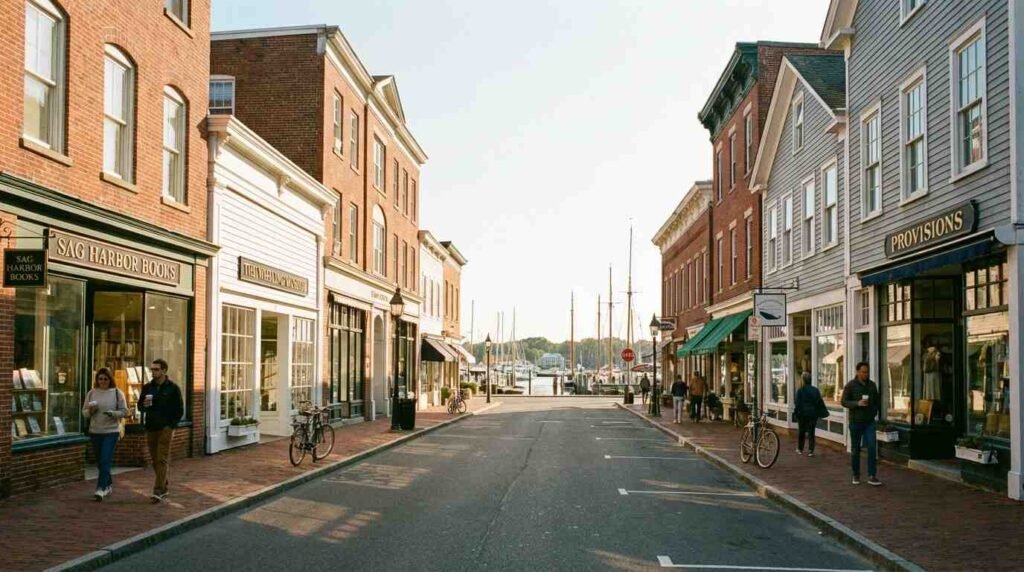
Sag Harbor’s Main Street functions the way it does — the continuous retail frontage, the foot traffic that actually justifies the restaurants that actually stay open, the village-scale density that makes you feel like you arrived somewhere rather than stopped somewhere — because of what didn’t happen there after 1850. The whaling industry didn’t just decline. It cratered. And when it did, it left behind a street grid that nobody had the economic momentum to tear up and re-plat into the larger, automotive-era parcels that eventually consumed the rest of Long Island. That frozen infrastructure is now worth a significant premium. Buyers paying $3M+ for a Sag Harbor village house are, in many cases, paying for a 19th-century industrial failure without knowing it.
I think they should know it. The story is better than the myth.
What the Plat Maps Show
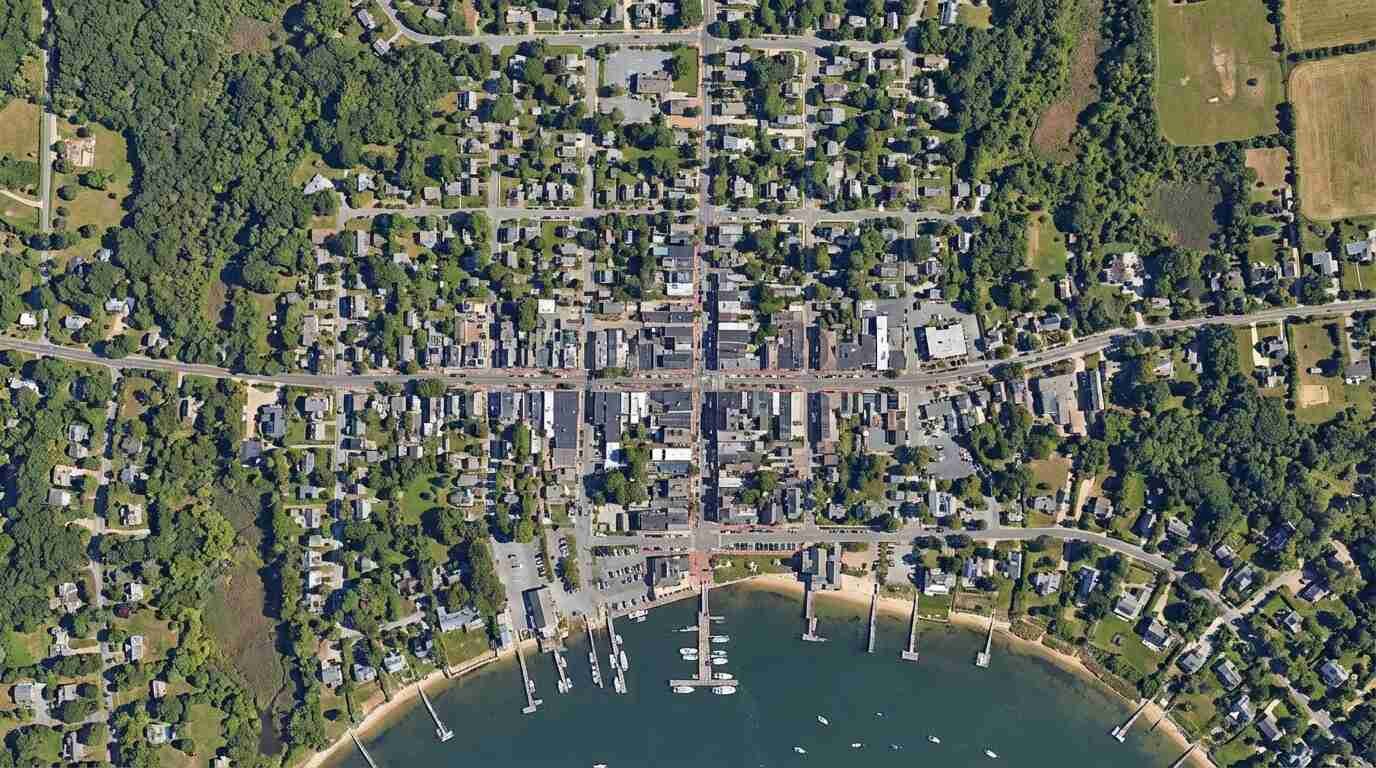
The Suffolk County Clerk’s office holds the original whaling-era subdivision maps for Sag Harbor, primarily from the 1840s–1870s series. What those maps document is a streetscape subdivided for commerce — specifically, for the support industries of a working whaling port. Chandleries, cooperages, sail lofts, ship outfitters, provisioners, rooming houses for transient crew: these businesses required street-level frontage, they needed to be walkable to the docks, and they operated at a scale that made 25-to-40-foot lot widths the functional unit of development.
These were not residential lots by design. They were commercial lots — sized for the volume and velocity of a port economy at its peak. When Suffolk County tax parcel data is analyzed today, Sag Harbor’s median lot width in the village core is verifiably narrower than the lot widths in East Hampton or Southampton village centers. That’s not an accident or a quirk of historical preservation. It’s the direct physical legacy of a particular industrial moment, locked into the legal record of subdivision and never altered.
The key word is “never.” When the whaling industry collapsed after 1850 — driven by the discovery of petroleum in Pennsylvania in 1859 and the preceding decades of declining whale populations and escalating voyage costs — Sag Harbor’s commercial infrastructure didn’t get recycled into a new economy that required larger parcels. It sat. The capital that would have funded re-subdivision wasn’t there. The development pressure that might have driven lot consolidation went elsewhere — to the resort economy that was beginning to reshape the East Hampton and Southampton waterfronts, but that largely bypassed Sag Harbor’s village core.
Academic work on American whaling port economics, including Paul Fontenoy’s scholarship published through Mystic Seaport, documents this pattern across multiple New England and mid-Atlantic whaling centers. Ports that lost their whaling industry before the automotive era froze their pre-industrial street grids in place. Ports that survived into the late 19th and early 20th centuries with a functioning economy often re-platted for the automobile and lost the pedestrian-scale infrastructure permanently. Sag Harbor got lucky by going broke at the right time.
The Walkability Premium: What the Data Actually Shows
Walk Score metrics, cross-referenced against MLSLI and StreetEasy sold data for the East End, show a consistent and quantifiable premium for Sag Harbor village properties relative to comparable inventory in East Hampton, Southampton, and Bridgehampton. The premium range — roughly 15 to 22 percent above comparable properties in less walkable East End locations — is not driven by the fame of the address or the prestige of the zip code alone. It’s driven by what buyers are actually getting: the ability to walk to dinner, to the hardware store, to the farmers market, to the waterfront, without a car.
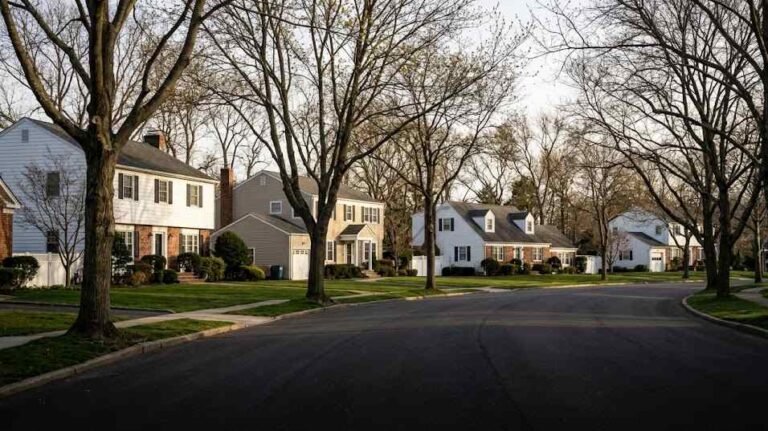
That is not a small thing on Long Island. It is, in fact, almost nowhere else on the island at this price point and quality level. I spend most of my professional life on the North Shore, where walkable village environments are precious and rare — Port Jefferson is the closest North Shore analog. The mechanisms are different between Port Jefferson and Sag Harbor, but the core dynamic is the same: density that predates the automobile is extraordinarily hard to recreate and extraordinarily valuable once buyers understand what they’re losing when they settle for something less.
Southampton Village and East Hampton Village, for all their prestige, have struggled to replicate Sag Harbor’s pedestrian character. This is not for lack of money or ambition. It’s for lack of the right lot widths. Their village cores were re-platted at scales that prioritize the car, and no amount of streetscape investment fully compensates for that.
The Whaling Economy in the Plat Record
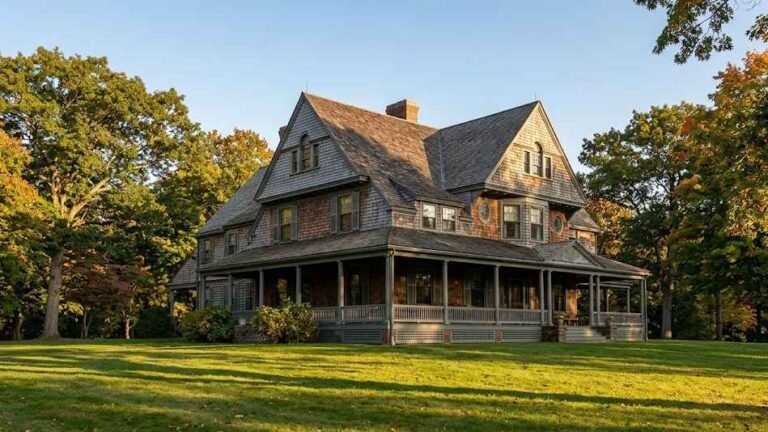
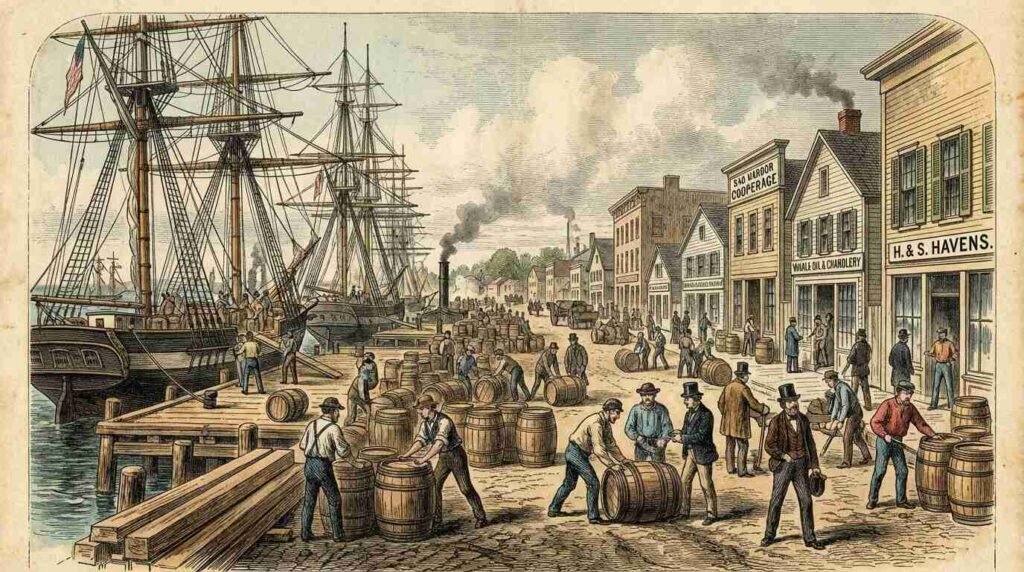
The Sag Harbor Whaling & Historical Museum’s archives preserve a record of the port’s peak years that is worth understanding in physical terms. At its height in the 1840s, Sag Harbor was the fourth-largest whaling port in America. The ships that operated out of Sag Harbor were primarily square-rigged vessels requiring substantial shore-side support: rope walk operations, barrel cooperages (a single long voyage could consume thousands of barrels), sail lofts, blacksmith shops for the ironware, provisioning operations of significant scale.
All of this infrastructure needed to be close to the water and accessible to crew, and the lot structure that supported it — narrow-fronted, deep, designed for commercial throughput rather than residential comfort — is what survived the collapse intact. When the last Sag Harbor whaling voyages departed in the 1870s and 1880s, the buildings that remained on those lots were simply repurposed for whatever economy replaced the whale oil trade, without any structural alteration to the parcels beneath them.
This is the mechanism that produced the Main Street you walk today. The building footprints shifted use. The lot lines didn’t move.
What This Means If You’re Buying in Sag Harbor
Several things follow from this history that I think matter for buyers in the current market.
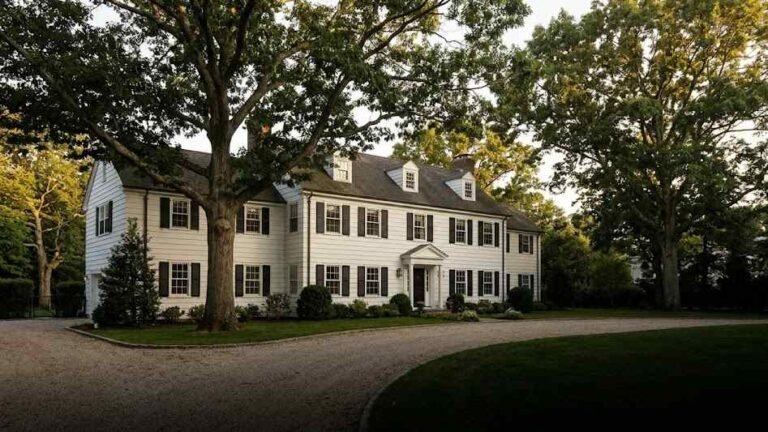
The premium is structural, not cyclical. You are not paying a Sag Harbor premium because the market is hot or because a particular moment in East End real estate has made the village fashionable. You are paying for an infrastructure configuration that cannot be replicated under any current regulatory or economic conditions. The lot widths are what they are because of a series of historical events that cannot be re-run. That makes the premium more durable than premiums driven by taste or trend.
The mixed-use character is protected by the same lot structure. The retail that makes Sag Harbor’s Main Street function the way it does is viable because the lot widths support the density that makes foot traffic sustainable. If the lots were wider — if re-platting had occurred at any point in the 20th century — the economics of street-level retail would shift toward the car-dependent strip model that has gutted Main Streets everywhere else on Long Island. The village’s commercial viability is a byproduct of its industrial history, and it is self-reinforcing.
Due diligence on lot lines matters here more than in most markets. Because many of the original whaling-era parcel configurations were established under 19th-century subdivision practices, the legal description of what you’re buying can be more complex than a standard modern subdivision. I always recommend a survey on Sag Harbor village properties — not just a title search. The boundaries are sometimes more interesting than the recorded description suggests.
The assessed value conversation is always worth having. Suffolk County’s property assessment practices create gaps between assessed and market value that are particularly pronounced in high-demand areas like Sag Harbor village. Understanding how the assessment system works before you close is not optional — it affects your carrying costs from day one and your negotiating position throughout the ownership period.
The Paradox at the Core of the Premium
I want to leave you with the thing that I think is genuinely counterintuitive about Sag Harbor’s market position, because I think it gets to something true about Long Island real estate more broadly.
The village’s most valuable quality — the walkability that produces the 15-to-22-percent premium, the pedestrian density that makes it feel like a real place rather than a destination, the mixed-use character that supports a functioning local economy rather than a seasonal caricature of one — is a direct product of economic failure. The whaling industry didn’t gracefully transition. It collapsed. The merchants and ship owners who built their businesses on those narrow commercial lots did not choose to preserve a pedestrian-scale streetscape for future generations. They ran out of money and left.
What survived was the infrastructure they couldn’t afford to change. And that infrastructure is now among the most desirable real estate on the East End.
Long Island’s history is full of these inversions — places whose value comes from what didn’t happen to them as much as from what did. The Fire Island shore road that disappeared beneath the Atlantic is another version of the same story: the losses that reshape a landscape and create the conditions for the value that comes after. I find that worth knowing, not because it changes the numbers, but because it clarifies what you’re actually buying when you buy on this island.
You’re not just buying a house. You’re buying a position in a history that keeps producing consequences, and the people who understand that history tend to make better decisions than the people who don’t.
Real estate markets change. This post reflects conditions as of the publish date. For current listings and market data, contact Pawli at Maison Pawli.
This post is for informational and historical purposes only and does not constitute legal or financial advice. Consult a licensed attorney or financial advisor for your specific situation.
Sources
- Sag Harbor Whaling & Historical Museum — Archives documenting port operations, voyage records, and commercial infrastructure of the peak whaling era (1820s–1870s). https://www.sagharborwhalingmuseum.org
- Suffolk County Clerk’s Office — Historical plat maps, Series 1840–1870, Sag Harbor village core subdivision records.
- Paul Fontenoy — Academic scholarship on American whaling port economics, published through Mystic Seaport Museum. https://www.mysticseaport.org
- MLSLI — Multiple Listing Service of Long Island, sold transaction data for East End comparative analysis. https://www.mlsli.com
- StreetEasy — East End sales data and market analytics. https://streeteasy.com
- Walk Score — Walkability index metrics, Sag Harbor and East End comparative data. https://www.walkscore.com
- Suffolk County tax parcel database — Lot width data, Sag Harbor village core vs. East Hampton and Southampton village comparisons.